Private Markets ESG

ESG Solutions for Private Markets to Power Smarter Decisions

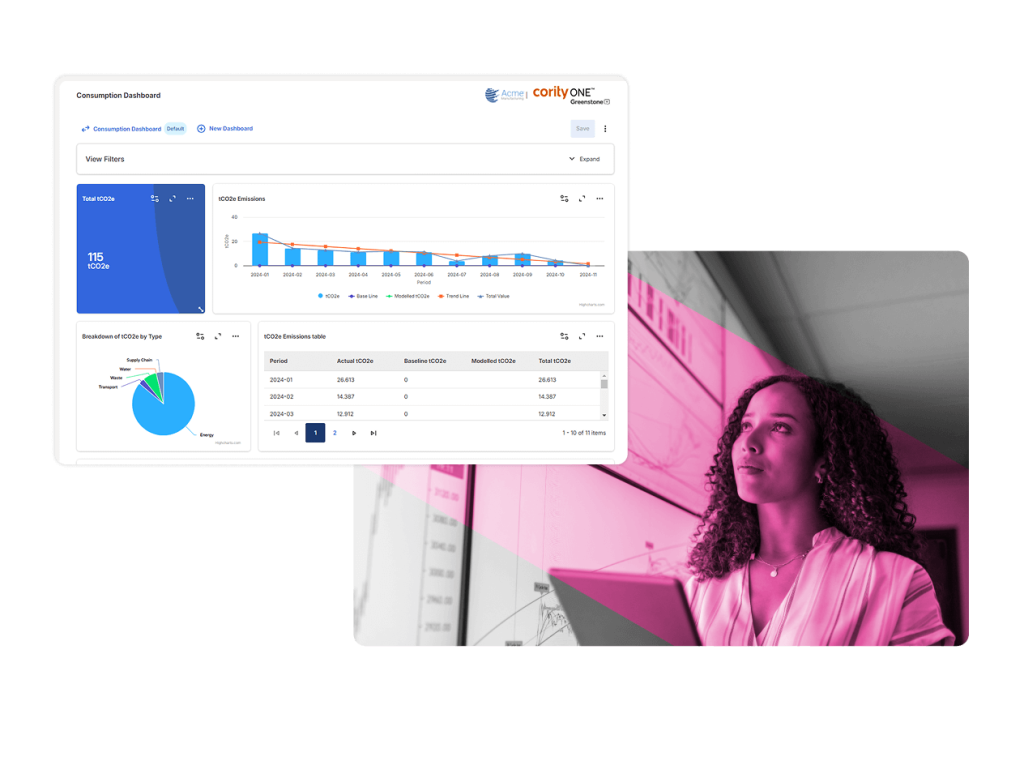
Unlock powerful ESG insights across portfolios to improve reporting, reduce risk, and drive long‑term value.

Built to securely report to global ESG data standards & frameworks.

SASB-logo
CDP-logo
GRI-logo
EGS-data-logo
PRI-logo

ESG Solution Benefits for Investors

icon-placeholder

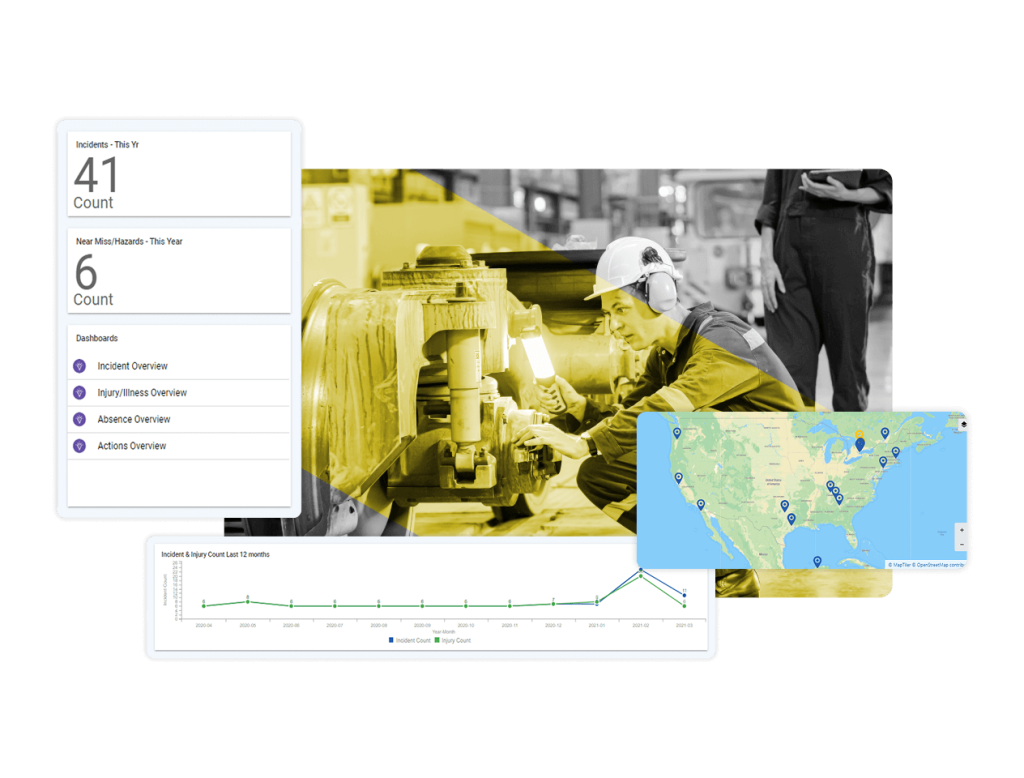
Stronger, Data-Led Decisions

Combine ESG & operational data for clear insight into portfolio risks and opportunities.

icon-placeholder

Simplified ESG Compliance

Deliver accurate ESG disclosures aligned to PCAF, UN PRI, EDCI, SFDR, and CSRD.

icon-placeholder

Smarter Risk Management

Spot ESG-linked risks early to protect value.

icon-placeholder

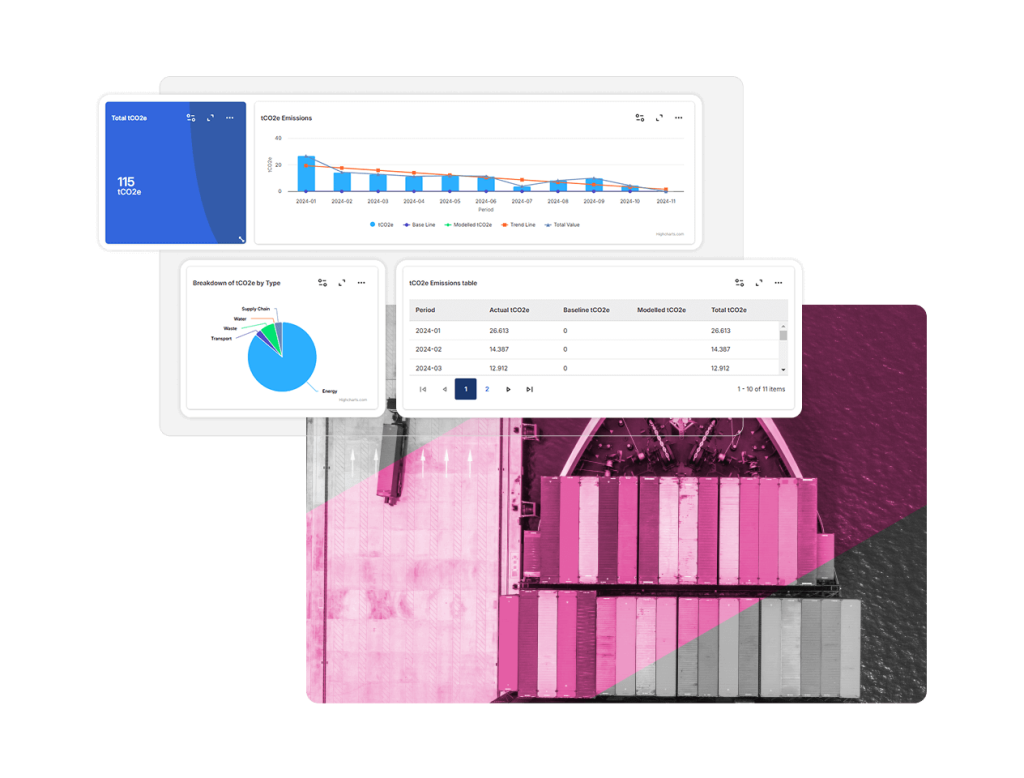
Precise Emissions Tracking

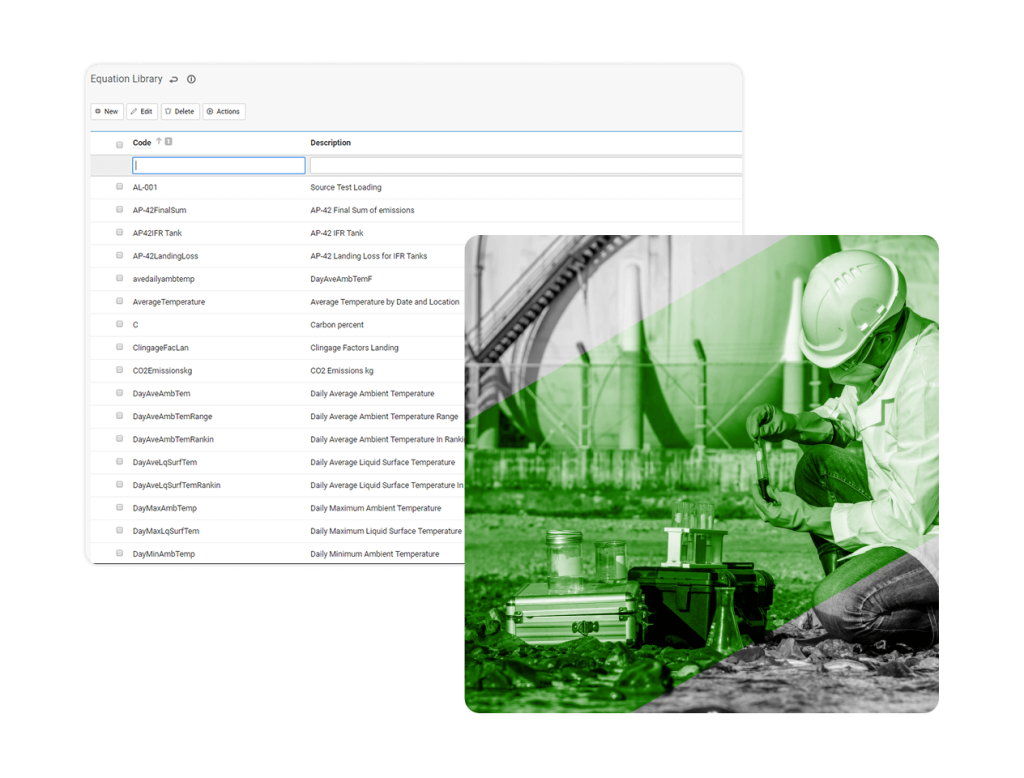
Calculate and manage financed emissions to meet reporting standards and climate goals.

EHS+ Solutions for Corporate Enterprises
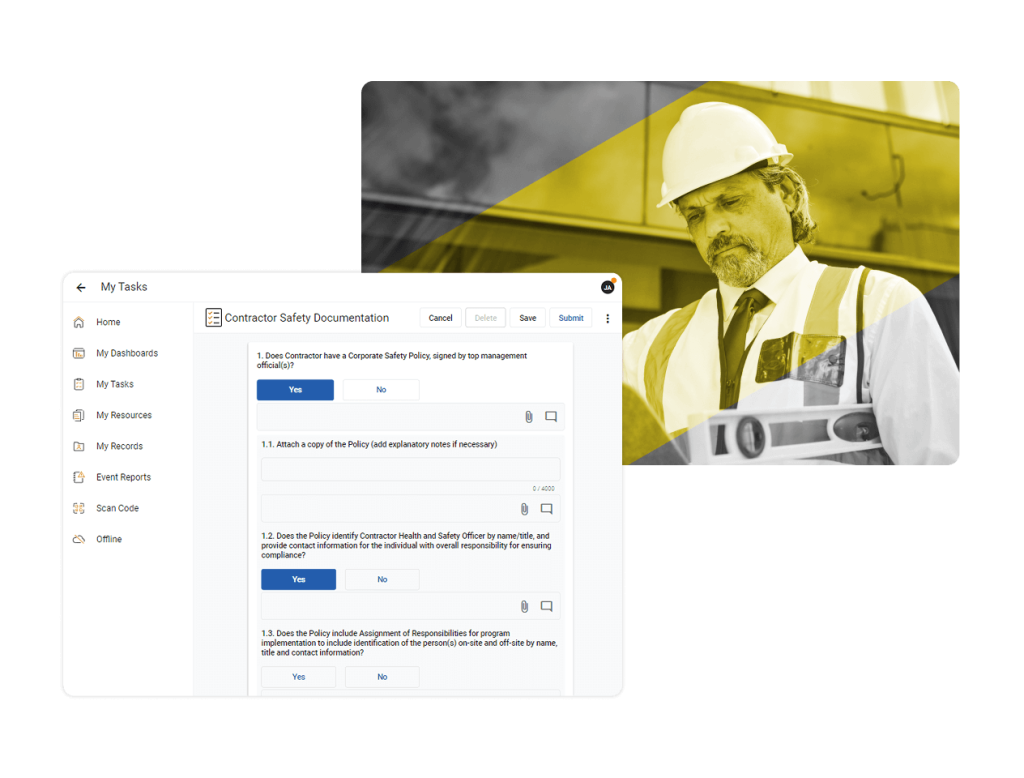
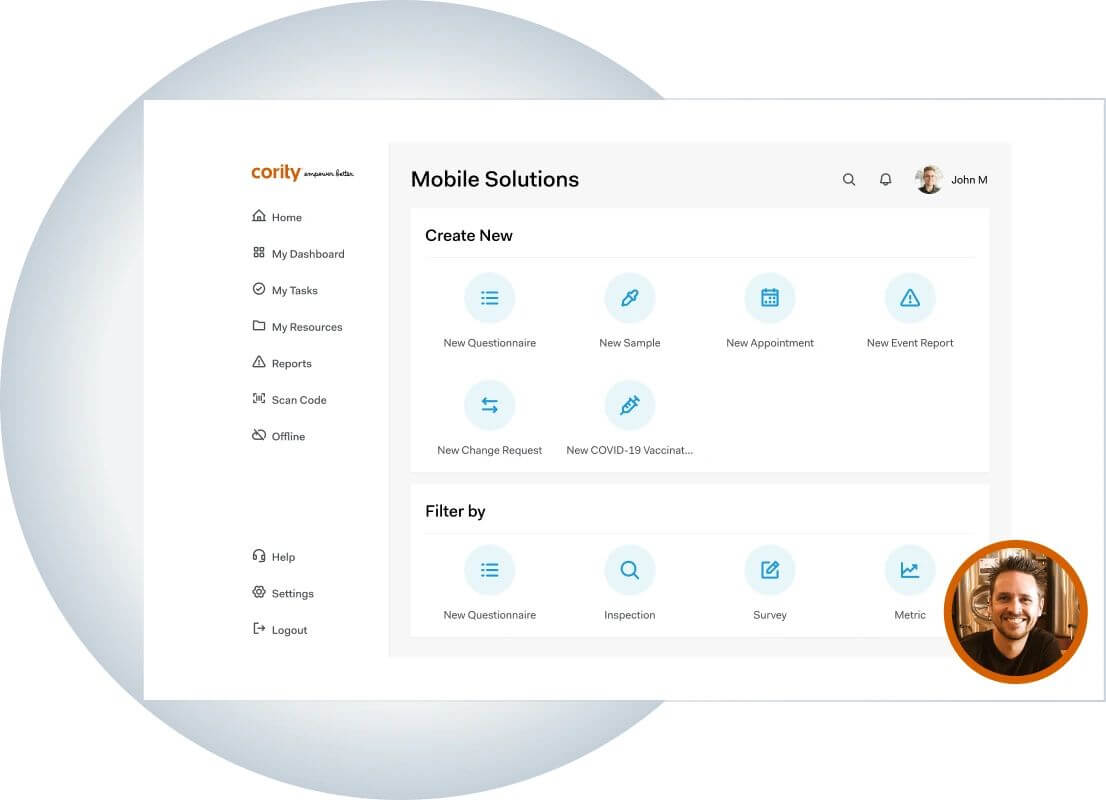
A digital event report form is displayed on the left, while on the right, a construction worker in a hard hat and safety vest gestures with his hands in a workshop, overlaid with a yellow geometric shape—showcasing advanced Industrial Hygiene Software.

Incident Management

Capture events from across EHS and Sustainability in a unified workflow.
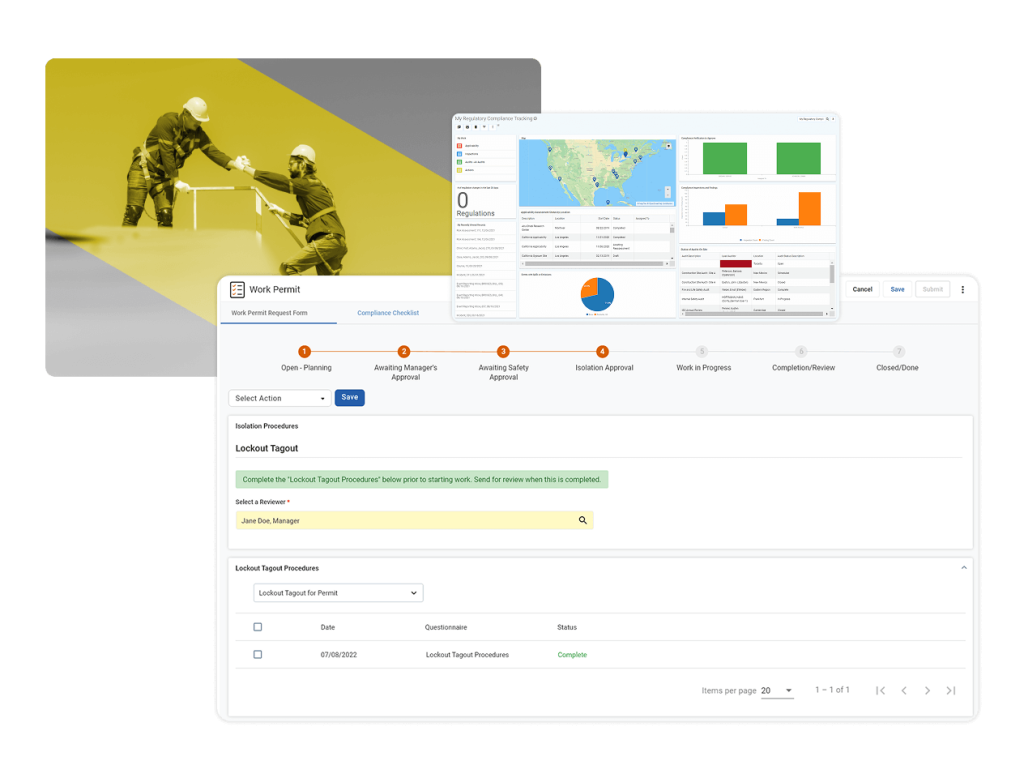
A construction worker in safety gear is overlaid with yellow, while a digital dashboard powered by Industrial Hygiene Software displays a checklist for contractor safety documentation and task management on the left side of the image.

Audit & Inspections

Handle OSHA, ISO, and internal audits with visibility across EHS+

A collage shows two workers in protective gear handling equipment on a yellow-tinted background, a dashboard with charts and maps, and an electronic permit to work software form highlighting a safety lockout-tagout procedure.

Root‑Cause Analysis

Correlate operational data with incidents from across your enterprise.

A collage highlights a worker inspecting machinery, incident statistics (41 incidents, 6 new hazards), a map with incident locations, a line graph of injury counts, and a dashboard menu featuring safety management software analytics.

Corrective Actions

Assign tasks and track improvements across programs, removing data silos.

A screenshot of an industrial hygiene software emissions reporting dashboard overlays a photo of industrial smokestacks emitting smoke, with a green diagonal stripe across the image.

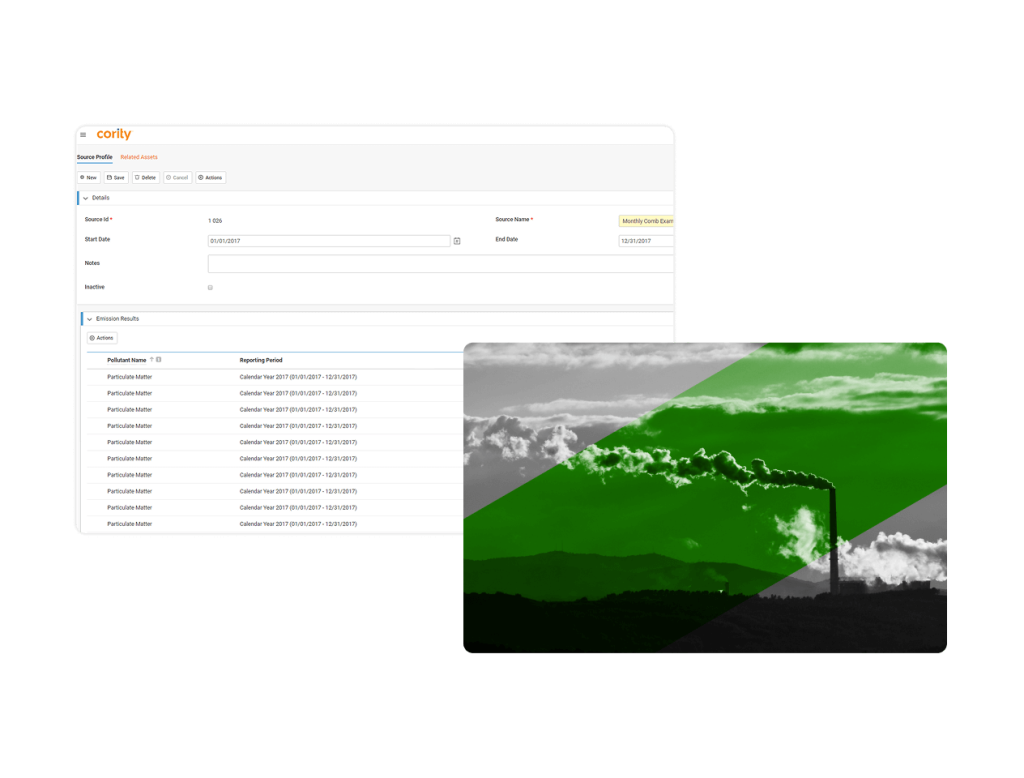
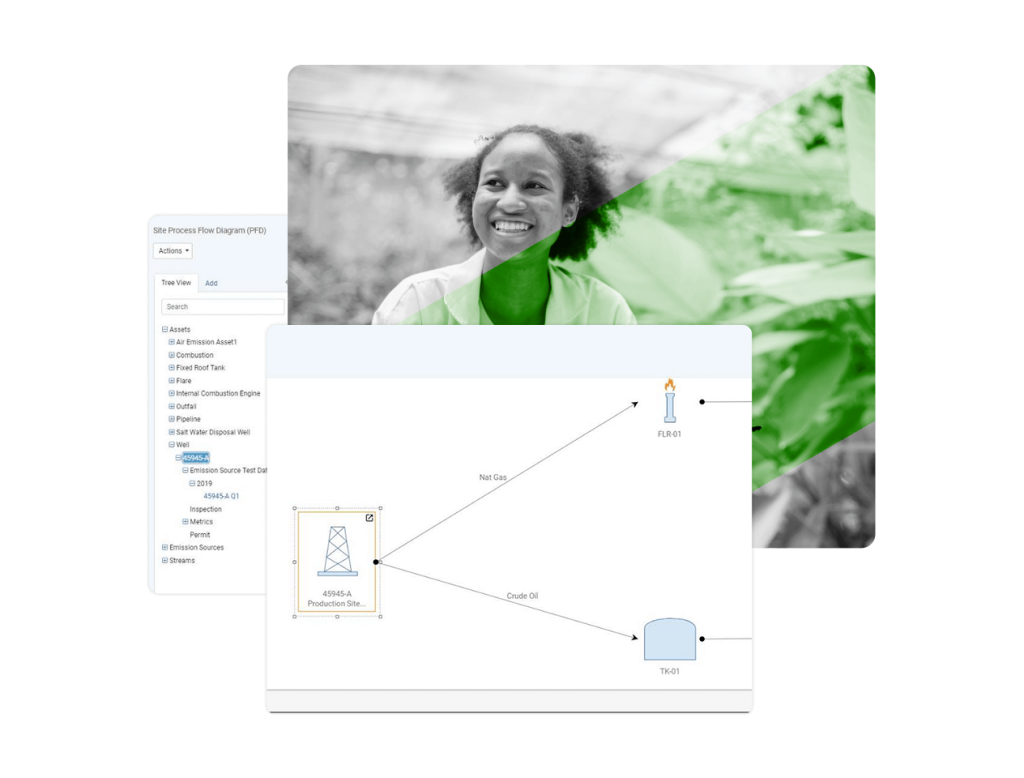
Air & Water Monitoring

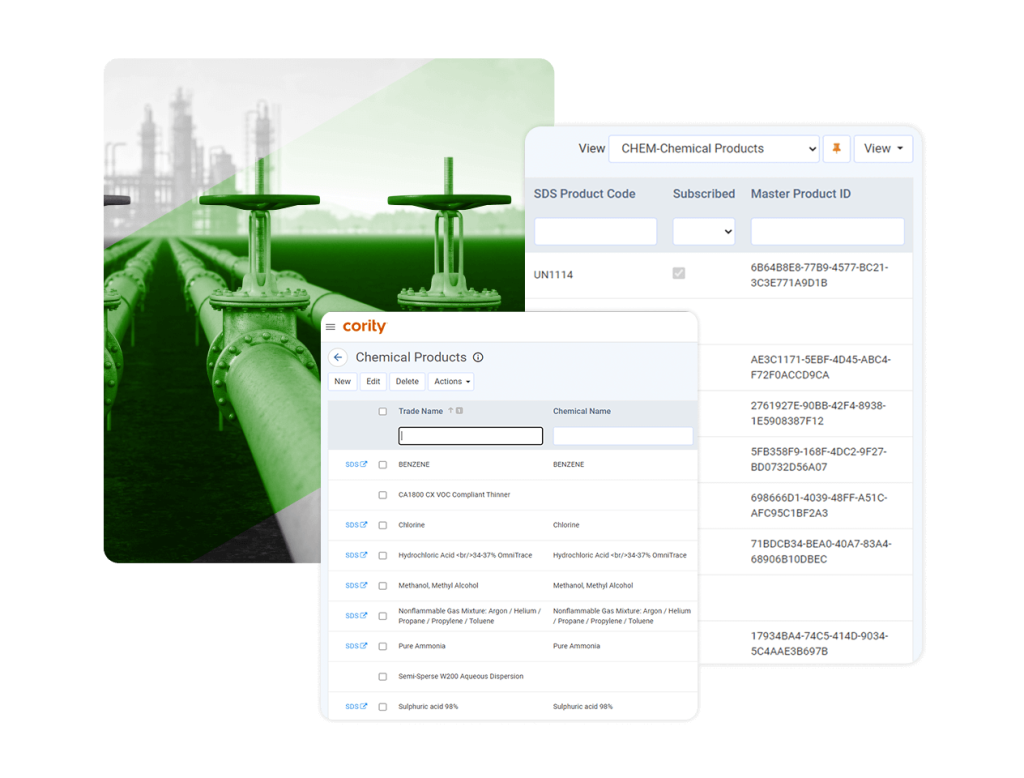
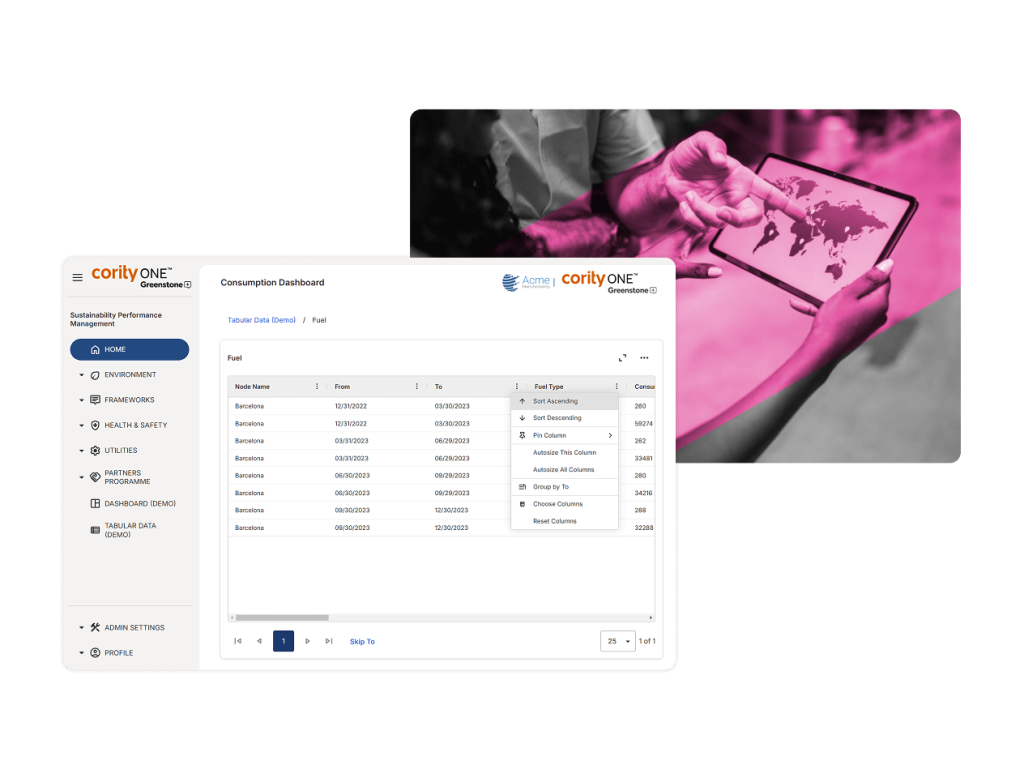
Collect and manage data from multiple portfolio companies and fund structures using customizable questionnaires and GHG emissions calculation tools.

A screenshot of an equation library table with codes and descriptions is overlaid with a green-tinted photo of a person in safety gear working at an industrial site, highlighting the use of Industrial Hygiene Software.

Waste Resources Tracking

Monitor waste streams and resource usage for sustainability.

A split image shows industrial green pipelines on the left and two digital interface screens on the right featuring Cority’s Industial Hygiene Software for chemical product tracking and safety data management.

Chemical Management

Centralize lifecycle and regulatory data tracking.

A smiling woman stands outdoors near green plants, overlaid with a semi-transparent screenshot of Industial Hygiene Software, featuring a flowchart diagram and a computer interface with a process tree.

Compliance Reporting

Automate EPA and global environmental submissions.

A grayscale image of a man sailing overlaid with a screenshot of ESG private equity software, displaying bar and pie charts, alongside tables with management or compliance data.

Carbon & Energy

Monitor emissions, energy, and more within one platform.

A dashboard with charts and graphs displays data on a screen, overlaid on an image of a woman holding a tablet and looking thoughtfully to the side. The photo has a pink tint, illustrating the use of Industrial Hygiene Software for data analysis.

Goal Tracking

Track net-zero benchmarks with EHS-informed data.

A digital dashboard titled Consumption Dashboard displays data in a table on a computer screen, alongside a photo of hands holding a tablet device, tinted pink—highlighting digital interaction and ESG private equity software-driven data analysis.

ESG Reporting

Issuer-ready disclosures combining EHS and sustainability metrics.

A digital dashboard powered by Supply Chain Sustainability Software displays graphs and charts of CO2 emissions data, including a line chart, pie chart, data table, and a pink-tinted overhead view of a container ship at a port.

Audit Trails

Maintain traceability across operational data.

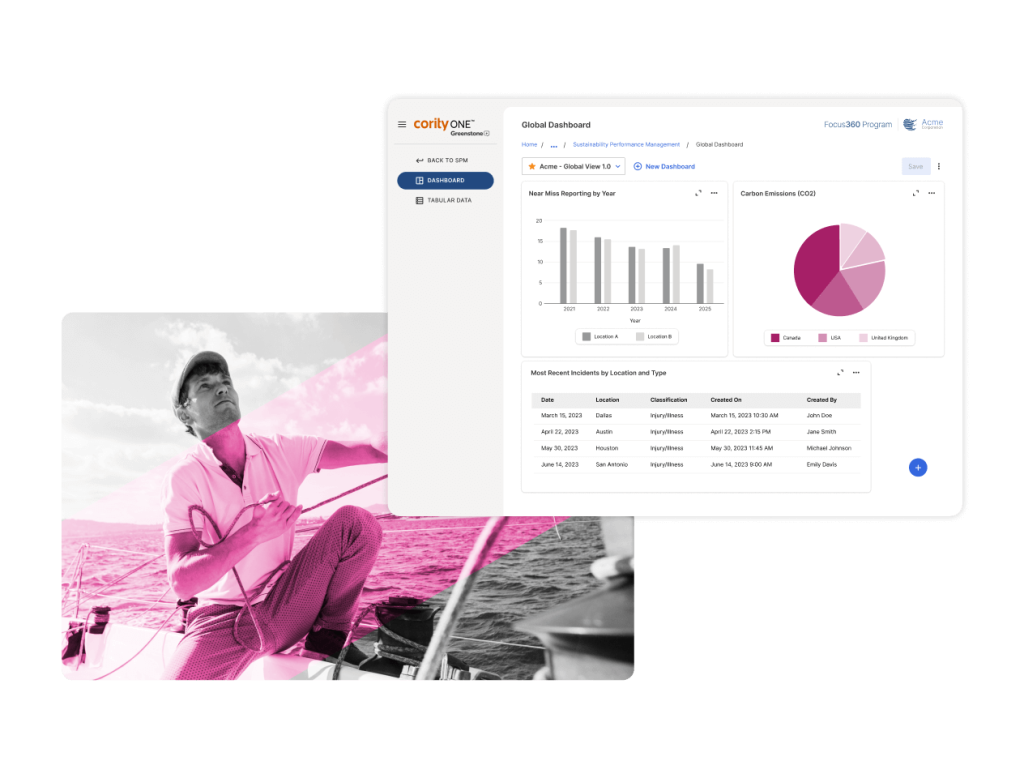
Integrated ESG Insights, Proven Value

225

Private market firms trust Cority to manage ESG data across investments.

$17T

Assets under management analyzed with integrated ESG metrics.

15+

Years helping investors turn ESG risk into measurable advantage.

Capterra Icon
Stars Image

4.3

Award‑Winning ESG Data Solutions for Investors

Recognized for trusted, investor-grade ESG data solutions. Celebrated for enabling transparency across private markets.
Verdantix Badge
Softwarecloud Badge
Capterra Badge
OHS Badge
GetApp Badge
here-goes-the-headline

See the Full ESG Picture Across Your Portfolio

Integrate ESG and operational data to meet investor expectations, reduce risk, and build long‑term portfolio value.

Resources

Two people walk through a futuristic, curved corridor with purple and blue lighting, glossy walls, and a striped design, reflecting a modern sci-fi atmosphere inspired by advanced Cortex AI technology.

Blog

A Letter from Our CEO: The World of EHS+ Is Changing. Cortex AI Is the Next Step

Blog

A Letter from Our CEO: The World of EHS+ Is Changing. Cortex AI Is the Next Step

By Ryan Magee, CEO, Cority Today at Converge Studio, we introduced Cortex AI — the new intelligence layer embedded across CorityOne. It’s a major step forward for our platform, but more importantly, it reflects a critical inflection point happening across the entire EHS+ world.  Cortex AI isn’t a departure from who we are. It’s the next

Cority announces the launch of Cortex AI, delivering trusted artificial intelligence for EHS with abstract images and a Learn more button on a white background.

News

Cority launches Cortex AI to deliver trusted artificial intelligence in EHS+

News

Cority launches Cortex AI to deliver trusted artificial intelligence in EHS+

Embedded AI layer and centralized “control center” aims to help customers apply AI agents to see and prevent risks across operations Toronto, ON — December 4, 2025 — Cority, the global leader in EHS+ software, today unveiled Cortex AI, a groundbreaking suite of intelligent agents

The white, sail-like roof structures of the Sydney Opera House stand out against a clear blue sky, with only the tops of the building visible in the image.

Blog

AASB S2 Compliance: Australia’s Mandatory Climate Reporting Guide

Blog

AASB S2 Compliance: Australia’s Mandatory Climate Reporting Guide

The Australian Sustainability Reporting Standards (ASRS) were issued by the Australian Accounting Standards Board (AASB) in September 2024. Known as AASB S1 and AASB S2, they are officially here and they’re changing the way Australian businesses disclose and confront climate risks. Designed for interoperability with

White text on a dark, grid-patterned background reads: SB 253 & SB 261: What Companies Need to Know and How to Get Ready for company compliance. The word cority appears below the main text.

Upcoming Webinars

SB 253 & SB 261: What Companies Need to Know and How to Get Ready

Upcoming Webinars

SB 253 & SB 261: What Companies Need to Know and How to Get Ready
Dec 9 2025 12PM EST
Abstract image featuring overlapping translucent shapes in shades of green, magenta, and teal, flowing together with smooth gradients and depth—evoking a sense of movement that aligns with action and visualizes no-regret metrics in dynamic form.

Blog

No-Regret Metrics: Turning Emissions Data into Action

Blog

No-Regret Metrics: Turning Emissions Data into Action

To compete, businesses must build sustainability into core operations by turning emissions data into action. This article was originally published on the Trellis website. For years, sustainability work has been about reporting, disclosing and measuring emissions, publishing targets and meeting disclosure deadlines. That foundational effort

A woman wearing glasses looks at a large, blurred screen displaying a yellow-toned world map, suggesting data analysis or monitoring of leading safety indicators in a technology-driven environment.

Blog

What Outperformers Do Differently: Lagging vs Leading Safety Indicators in EHS

Blog

What Outperformers Do Differently: Lagging vs Leading Safety Indicators in EHS

For so many EHS professionals, individual performance is measured by what’s already happened. Incident rates, lost time, and compensation claims – these units are seen as the standard indication for the success or failure of EHS programs. As such, you’d be forgiven for thinking the